
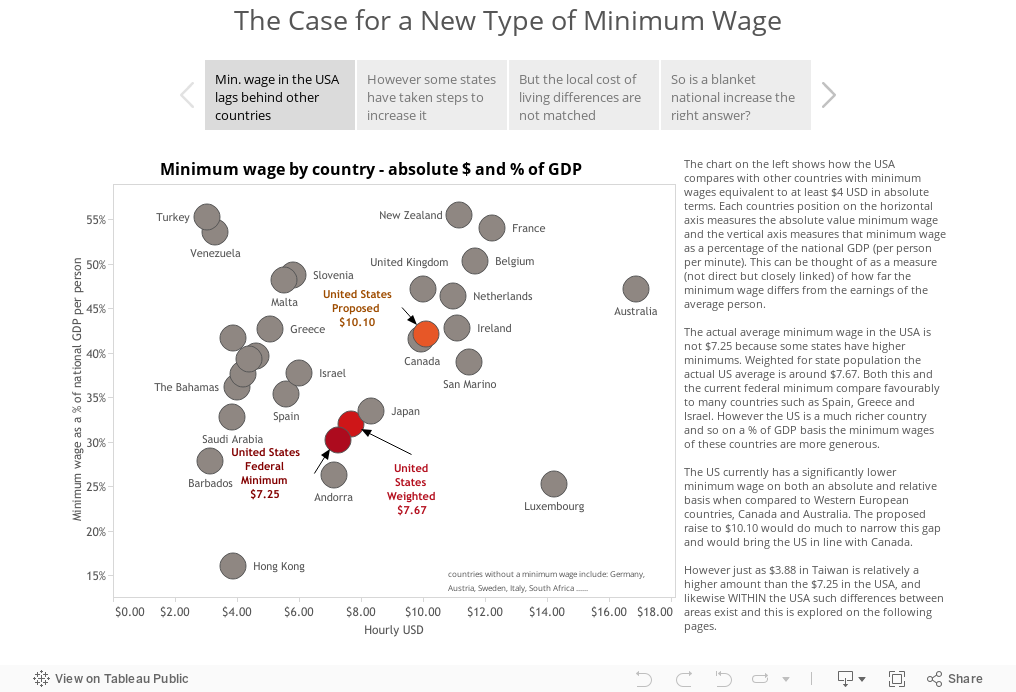
So I decided to try it out and re-work one of my recent vizes into a story, using my Mac of course. I chose the minimum wage viz because it already fit into a story. The original is here, let me know what you think of the differences between the two.
A few of my early thoughts on the new Story Points feature:
To be honest, when story points was announced, I was a little skeptical for a few reasons. I’ll address each of these below.
1. The functionality isn’t that different from having multiple tabs in a published Tableau workbook, and I know from experience that people don’t often click past the first tab in that environment so I wondered if this would be any different.
I am however seeing how story points works pretty well in leading people through the vizes. The simple and clean design change of having the story point headlines clear across the top does I think engage the viewer enough to want to click through to the next page. It also sets in the mind of the author more of an impetus to create that connected story, rather than just a series of seemingly disconnected dashboards.
2. Its applicability in an enterprise setting seems niche, and there are other developments that perhaps should have taken precedence over this in the release cycle.
My initial reaction to story points was that it will be great for Tableau Public and for data journalists, but will have limited appeal within businesses where timely, accurate reporting is still a high priority and powerpoint rules the roost for sharing stories. I think this will be the case for a while, but I am interested to see how the use of story points develops in a large business setting as Tableau Server becomes more mainstream and business users begin to experiment with the tool.
3. Creativity is limited compared to the single dashboard approach.
This may seem counter-intuitive, but I believe that the design thinking behind producing a single screen dashboard that allows the user to explore a story at their own pace requires a greater amount of creative thought than the creation of a guided story. I am a big fan of ‘seeing everything in one place’ and so for me story points doesn’t create that same excitement I get from seeing the single stand-out viz. Having said that, there is already some great work going out on Tableau Public so my mind is starting to change (see these examples by Matt Francis and Carl Allchin). And I’m sure that people are really going to start pushing the envelope with it as it becomes more familiar.
On a more tactical note, the current version of story points is quite restrictive in the design options available. As you will have seen from my viz designs, I’m a big fan of using images, shapes and custom fonts to add to the overall look and feel of a dashboard and help unify the theme. This is much less possible with story points as I can’t use an image for the title, and those grey boxes are very restrictive in size, color and font. Also the grey boxes suffer from a mismatch between how the words fit in desktop and how they look once published.
4. It has been billed in some quarters as ‘the power point killer’.
I don’t see this happening for a long time! Don’t get me wrong, I love the idea of more people using Tableau to present, and when you are presenting a data heavy story I do think that Tableau story points will catch on. The main problem though is Tableau is not really designed for those ‘non-data’ elements, such as images and text. In fact to get my dashboards looking just right I often do a lot of design and creative work in powerpoint before exporting images into Tableau.
Microsoft have I think done a really solid job in improving the design functions of Powerpoint and that’s going to be hard for Tableau to compete with. And actually I don’t think they should compete on that front. In the future I see more of a split in presentation tools, Powerpoint will still exist but Tableau will be used in some more situations, as will other popular tools like Prezi.
Overall I like this addition to the Tableau tool set, but I feel its a work in progress and I expect the community and many great Tableau Public authors will help steer its development.
Thanks for honest review, Pete. I prefer your Storypoint version. I find the act of clicking through Storypoints acts as a useful pause between points. It helps delineate where you as the author want my thoughts to stop, start and move from and to.
ReplyDeleteWhen I scroll through your original, I find it harder to follow the story and end up scanning the last point or two.
That said - I'm a trained user in Storypoints. I wonder how obvious the act of clicking on the Storypoints is to new users. Also, as you highlight in the post, you have more options to format the top of the original design. Your original has a headline that is more attention-grabbing due to its formatting.